Most recent BDB-Lab papers
BDB-Lab Links
Major Projects
Other Links
Lab Members
Twitter feed
Tweets by BigDataBiologyAnalysing microbiome count data using microbiopy
by Karma Dolkar, Luis Pedro Coelho.
The Microbiome
The microbiome is a collection of all microbes in an environment. Many different bacterial, fungal, and archaeal species constitute the microbial consortia. They can be found in a variety of environments, ranging from the human body (like the mouth, skin, gut), animal body, soil, glacier ice, seawater, or even walls or floors of homes.
Microbiopy
Analysing microbiome samples can show microbiome patterns that help predict the characteristics of the host under consideration. Features include characteristics like weight (lean, overweight), age, sex, cohort, and similar attributes. Microbiopy does this by filtering features across samples based on minimum prevalence, minimum prevalence fraction, minimum average abundance, and minimum abundance fraction. Additionally, Microbiopy implements Principal Component Analysis on the data to show relationships in two dimensions.
Analysis Functions
There are two functions that Microbiopy can currently perform:
- Filter Features
- Principal Component Analysis
Filter Features is a function that filters features across samples based on different criteria. The inputs are a sample by feature matrix and one or more of the following filtering criteria (in the following order):
- Minimum prevalence
- Minimum prevalence fraction
- Minimum average abundance
- Minimum abundance fraction
Prevalence is the proportion of samples containing a certain organism. Abundance is a measure of how commonly an organism occurs across samples.
Principal Component Analysis is a dimension-reduction machine learning method, which can be used to show information along the components that carry the most of it. It helps improve interpretation of data. Before carrying out PCA, microbiopy will perform a logarithmic transform of the data.
- Data Preparation for PCA
The input data is a sample by feature matrix. It is firstly converted to a numpy array. Next, a logarithmic transform is performed on it using the log_transfrom() function.
- PCA
The do_pca() function carries out PCA on the log transformed input data.
- Plotting PCA results
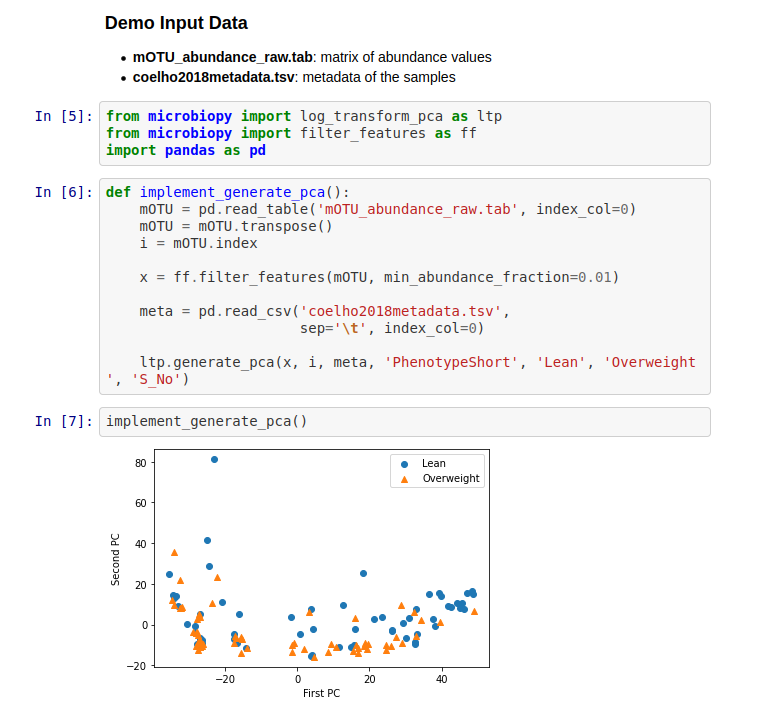
The generate_pca() function generates a scatter plot of the PCA results.
Results
After filtering the data based on prevalence and/or abundance and performing PCA on it, Microbiopy yields a two-dimensional visualization of the data.
Conclusion
Microbiopy implements machine learning analysis on microbiome count data and serves as a proof of concept for utilising Python to achieve the same.
Demonstration and Code
Copyright (c) 2018–2026. Luis Pedro Coelho and other group members. All rights reserved.